Line Graphs
Författare:
chathuri
Last Updated:
för 9 år sedan
Licens:
Creative Commons CC BY 4.0
Sammanfattning:
LaTeX codes for line charts
\begin
Discover why over 25 million people worldwide trust Overleaf with their work.
LaTeX codes for line charts
\begin
Discover why over 25 million people worldwide trust Overleaf with their work.
\documentclass[12pt]{article}
\usepackage[utf8]{inputenc}
\usepackage{graphicx}
\usepackage{pgfplots}
\pgfplotsset{compat=1.14}
%enter the data sets as follows.
\begin{filecontents}{thu2.dat}
X Time Part1 Part2
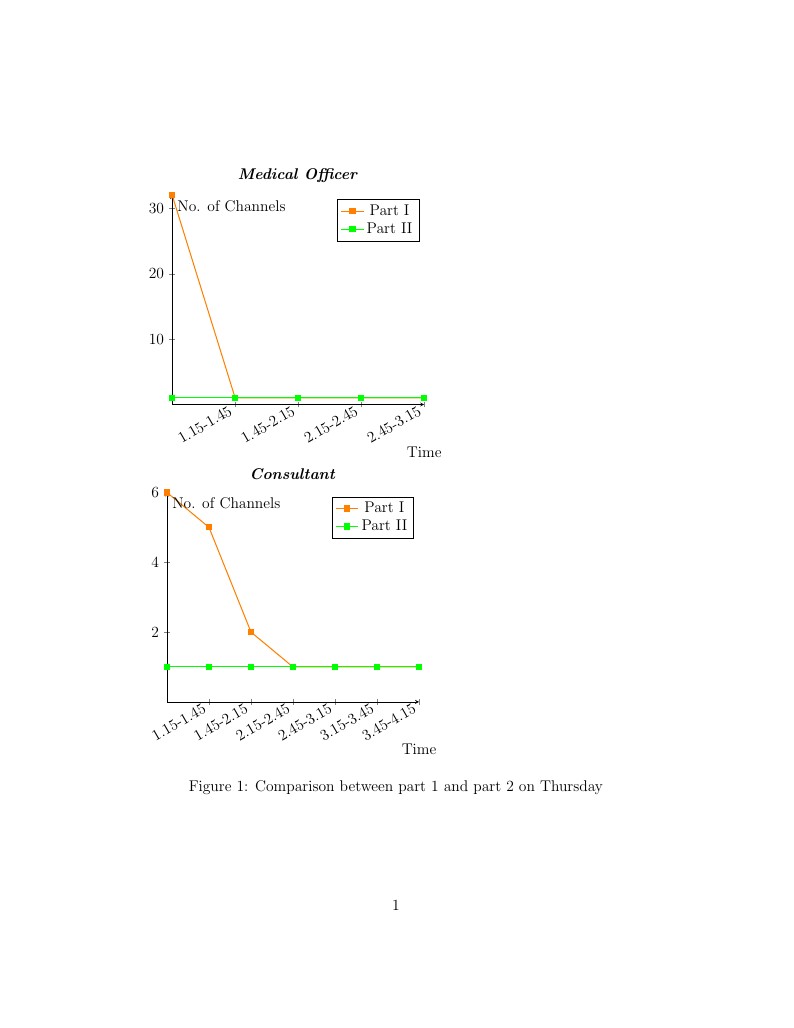
1 12.45-1.15 32 1
2 1.15-1.45 1 1
3 1.45-2.15 1 1
4 2.15-2.45 1 1
5 2.45-3.15 1 1
\end{filecontents}
\begin{filecontents}{thu3.dat}
X Time Part1 Part2
1 12.45-1.15 6 1
2 1.15-1.45 5 1
3 1.45-2.15 2 1
4 2.15-2.45 1 1
5 2.45-3.15 1 1
6 3.15-3.45 1 1
7 3.45-4.15 1 1
\end{filecontents}
\begin{document}
\begin{figure}[h!]
\begin{tikzpicture}
\begin{axis}[
axis lines=middle,
ymin=0,
x label style={at={(current axis.right of origin)},anchor=north, below=10mm},
title={\textit{\textbf{Medical Officer}}},
xlabel=Time,
ylabel=No. of Channels,
xticklabel style = {rotate=30,anchor=east},
enlargelimits = false,
xticklabels from table={thu2.dat}{Time},xtick=data]
\addplot[orange,thick,mark=square*] table [y=Part1,x=X]{thu2.dat};
\addlegendentry{Part I}
\addplot[green,thick,mark=square*] table [y= Part2,x=X]{thu2.dat};
\addlegendentry{Part II}]
\end{axis}
\end{tikzpicture}
\begin{tikzpicture}
\begin{axis}[
axis lines=middle,
ymin=0,
x label style={at={(current axis.right of origin)},anchor=north, below=10mm},
title={\textbf{\textit{Consultant}}},
xlabel=Time,
ylabel=No. of Channels,
xticklabel style = {rotate=30,anchor=east},
enlargelimits = false,
xticklabels from table={thu3.dat}{Time},xtick=data]
\addplot[orange,thick,mark=square*] table [y=Part1,x=X]{thu3.dat};
\addlegendentry{Part I}
\addplot[green,thick,mark=square*] table [y= Part2,x=X]{thu3.dat};
\addlegendentry{Part II}
\end{axis}
\end{tikzpicture}
\caption{Comparison between part 1 and part 2 on Thursday}
\end{figure}
\end{document}