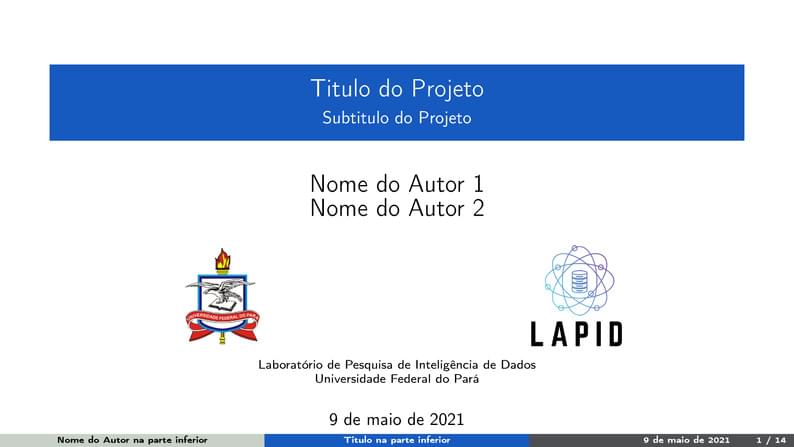
Template Apresentação LAPID
Författare:
Elton Sarmanho
Last Updated:
för 5 år sedan
Licens:
Creative Commons CC BY 4.0
Sammanfattning:
Template de apresentação

\begin
Discover why over 25 million people worldwide trust Overleaf with their work.
Template de apresentação

\begin
Discover why over 25 million people worldwide trust Overleaf with their work.
\documentclass[10pt,aspectratio=169]{beamer}
% \mode<presentation>{}

\usepackage{media9}
\usepackage{amssymb,amsmath,amsthm,enumerate}
\usepackage[brazil]{babel}
\usepackage[utf8]{inputenc}
\usepackage{array}
\usepackage[parfill]{parskip}
\usepackage{graphicx}
\usepackage{caption}
\usepackage{subcaption}
\usepackage{bm}
\usepackage{amsfonts,amscd}
\usepackage[]{units}
\usepackage{listings}
\usepackage{multicol}
\usepackage{multirow}
\usepackage{tcolorbox}
\usepackage{physics}
\usepackage[T1]{fontenc}

\usenavigationsymbolstemplate{}

% Enable colored hyperlinks
\hypersetup{colorlinks=true}

% The following three lines are for crossmarks & checkmarks
\usepackage{pifont}% http://ctan.org/pkg/pifont
\newcommand{\cmark}{\ding{51}}%
\newcommand{\xmark}{\ding{55}}%

% Numbered captions of tables, pictures, etc.
\setbeamertemplate{caption}[numbered]

%\usepackage[superscript,biblabel]{cite}
\usepackage{algorithm2e}
\renewcommand{\thealgocf}{}

% Bibliography settings
\usepackage[style=ieee]{biblatex}
\setbeamertemplate{bibliography item}{\insertbiblabel}
\addbibresource{references.bib}

% Glossary entries
\usepackage[acronym]{glossaries}
\newacronym{ML}{ML}{machine learning}
\newacronym{HRI}{HRI}{human-robot interactions}
\newacronym{RNN}{RNN}{Recurrent Neural Network}
\newacronym{LSTM}{LSTM}{Long Short-Term Memory}


\theoremstyle{remark}
\newtheorem*{remark}{Remark}
\theoremstyle{definition}

\newcommand{\empy}[1]{{\color{darkorange}\emph{#1}}}
\newcommand{\empr}[1]{{\color{cardinalred}\emph{#1}}}
\newcommand{\examplebox}[2]{
\begin{tcolorbox}[colframe=darkcardinal,colback=boxgray,title=#1]
#2
\end{tcolorbox}}

\usetheme{Stanford}
\input{./style_files_stanford/my_beamer_defs.sty}
 \logo{\includegraphics[height=0.40in]{Imagens/Logo LAPID2.png}}

% commands to relax beamer and subfig conflicts
% see here: https://tex.stackexchange.com/questions/426088/texlive-pretest-2018-beamer-and-subfig-collide
\makeatletter
\let\@@magyar@captionfix\relax
\makeatother

%-------------------------TITULO/SUBTITULO DO PROJETO------------------------------------

\title[\textcolor{white}{Titulo na parte inferior}]{Titulo do Projeto}
\subtitle{Subtitulo do Projeto}
%----------------------------------------------------------------------------------------

%\beamertemplatenavigationsymbolsempty

\begin{document}
%-----------------------INFORMAÇOES DO PROJETO---------------------------------------
\author[Nome do Autor na parte inferior]{
	\begin{tabular}{c}
	\Large
	Nome do Autor 1\\
	\Large
	Nome do Autor 2
%-----------------------ADICIONAR E-MAIL---------------------------------------
    % \footnotesize \href{mailto:authoremail@stanford.edu}{authoremail@stanford.edu}
\end{tabular}
\vspace{-4ex}}
%---------------------------LOGO DA INSTITUIÇÃO------------------------------
\institute{
	\vskip 5pt
	\begin{figure}
		\centering
		\begin{subfigure}[t]{0.5\textwidth}
			\centering
			\includegraphics[height=0.80in]{Imagens/Logo UFPA.png}
		\end{subfigure}%
		~
 		\begin{subfigure}[t]{0.5\textwidth}
 			\centering
 		 \includegraphics[height=0.80in]{Imagens/Logo LAPID.png}
 		\end{subfigure}
	\end{figure}
	\vskip 5pt
	Laboratório de Pesquisa de Inteligência de Dados\\
 	Universidade Federal do Pará\\
%  	\vskip 1cm
}

% \date{June 15, 2020}
\date{\today}

\begin{noheadline}
\begin{frame}\maketitle\end{frame}
\end{noheadline}

\setbeamertemplate{itemize items}[default]
\setbeamertemplate{itemize subitem}[circle]

%------------------------------------------------------------------------
\section{Objetivos}
\begin{frame}[fragile]{Objetivos}
\begin{block}{Objetivo Principal}
\begin{itemize}
  \item xxxx
\end{itemize}
\end{block}


\begin{block}{Etapas de Execução}
\begin{itemize}
  \item Análise do Dataset (\url{https://www.dropbox.com/s/n7jrz7gd0js9xy6/dataset_ipe.csv?dl=1})
  \item Filtrar as espécies
  \item Aplicar Matriz de Correlação
  \item Aplicar a “clusterização”
  \item Plotar gráfico de dispersão
\end{itemize}
\end{block}
\end{frame}

%--------------------------------------------------------------------

\section{Análise do Dataset}
\begin{frame}[fragile]{Análise do Dataset}
% \begin{block}{dataset\_ipe.xlsx}
\begin{figure}
    \centering
    \includegraphics[height=6.9cm, width=11.5cm]{Imagens/dataset ipe.png}
\end{figure}
% \end{block}
\end{frame}

%--------------------------------------------------------------------

\section{Filtragem das Espécies}
\begin{frame}[fragile]{Filtragem das Espécies}
% \begin{block}{dataset\_ipe.xlsx}
\begin{figure}
    \centering
    \includegraphics[height=6.8cm, width=13cm]{Imagens/marcacao.png}
\end{figure}
% \end{block}
\end{frame}

%--------------------------------------------------------------------


\begin{frame}[fragile]{Filtragem das Espécies}
% \begin{block}{dataset\_ipe.xlsx}
\begin{figure}
    \centering
    \includegraphics[height=3.8cm, width=14cm]{Imagens/ds3.png}
\end{figure}
% \end{block}
\end{frame}

%--------------------------------------------------------------------


\begin{frame}[fragile]{Filtragem das Espécies}
% \begin{block}{dataset\_ipe.xlsx}
\begin{figure}
    \centering
    \includegraphics[height=3.8cm, width=14cm]{Imagens/ds4.png}
\end{figure}
% \end{block}
\end{frame}

%--------------------------------------------------------------------


\begin{frame}[fragile]{Filtragem das Espécies}
% \begin{block}{dataset\_ipe.xlsx}
\begin{figure}
    \centering
    \includegraphics[scale=0.6]{Imagens/ds5.png}
\end{figure}
% \end{block}
\end{frame}

%--------------------------------------------------------------------

\section{Matriz de Correlação}
\begin{frame}[fragile]{Matriz de Correlação}
% \begin{block}{dataset\_ipe.xlsx}
\begin{figure}
    \centering
    \includegraphics[height=6cm, width=14cm]{Imagens/mc.png}
\end{figure}
% \end{block}
\end{frame}

%--------------------------------------------------------------------
\section{Clusterização}
\begin{frame}[fragile]{Clusterização}
% \begin{block}{dataset\_ipe.xlsx}
\begin{figure}
    \centering
    \includegraphics[scale=0.4]{Imagens/ds6.png}
\end{figure}
% \end{block}
\end{frame}

%--------------------------------------------------------------------
\section{Gráfico de Dispersão}
\begin{frame}[fragile]{Gráfico de Dispersão}
% \begin{block}{dataset\_ipe.xlsx}
\begin{figure}
    \centering
    \includegraphics[scale=0.4]{Imagens/gd.png}
\end{figure}
% \end{block}
\end{frame}

%--------------------------------------------------------------------
\section{Espécies Identificadas}
\begin{frame}[fragile]{Espécies Identificadas}
% \begin{block}{dataset\_ipe.xlsx}
\begin{figure}
    \centering
    \includegraphics[scale=0.4]{Imagens/Imagem2.png}
\end{figure}
% \end{block}
\end{frame}

%--------------------------------------------------------------------
\section{Resultados Obtidos}
\begin{frame}[fragile]{Resultados Obtidos}
% \begin{block}{dataset\_ipe.xlsx}
\begin{itemize}
    \item 5 espécies foram identificadas como Handroanthus Serratifolius
    \item 3 Handroanthus cf. Serratifolius não tiveram similaridade com nenhuma espécie
    \item De 17 espécies que foram analisadas, 14 foram confirmadas como Handroanthus Serratifolius e 3 não foram identificadas
    \item Os datasets ``dataset\_ipê'' e ``dataset\_ipe\_categorico'' já estão atualizados com os novos dados
\end{itemize}
% \end{block}
\end{frame}


%--------------------------------------------------------------------
\section{Metas para a próxima analise}
\begin{frame}[fragile]{Metas para a próxima analise}
\begin{block}{Objetivo Concluído}
\begin{itemize}
    \item Determinar quais “Handroanthus cf. serratifolius” são realmente Handroanthus serratifolius
\end{itemize}
\end{block}

\begin{alertblock}{Próximo Objetivo}
\begin{itemize}
    \item Verificar quem são os Handroanthus impetiginosus a partir dos Handroanthus cf. impetiginosus
    \item Criar classificador para as espécies ``Handroanthus serratifolius'' e ``Handroanthus impetiginosuss''
\end{itemize}
\end{alertblock}


\end{frame}

\section{Referências Bibliográficas}
\begin{frame}[t,allowframebreaks]
\frametitle{Referências}
%\bibliographystyle{amsalpha}
%\bibliography{bibfile}
\begin{thebibliography}{*}

        \bibitem[A01]{A01} Lee K.D., Hubbard S. (2015) Trees. In: Data Structures and Algorithms with Python. Undergraduate Topics in Computer Science. Springer, Cham. Retrieved from \url{https://doi.org/10.1007/978-3-319-13072-9_6}

        \bibitem[A04]{A04} Ascenio, Ana Fernanda Gomes. Estrutura de dados: Algoritmos, análise da complexidade e implementações em Java e C++. São Paulo: Pearson Prentice Hall, 2010.

        \bibitem[A07]{A07} Capítulo 20: Árvores — documentação Aprenda Computação com Python 3.0 2009.1. Retrieved from  \url{https://mange.ifrn.edu.br/python/aprenda-com-py3/capitulo_20.html}
\end{thebibliography}
\end{frame}


\end{document}