overleaf template galleryLaTeX examples — Recent
Examples to help you learn how to use powerful LaTeX packages and techniques.
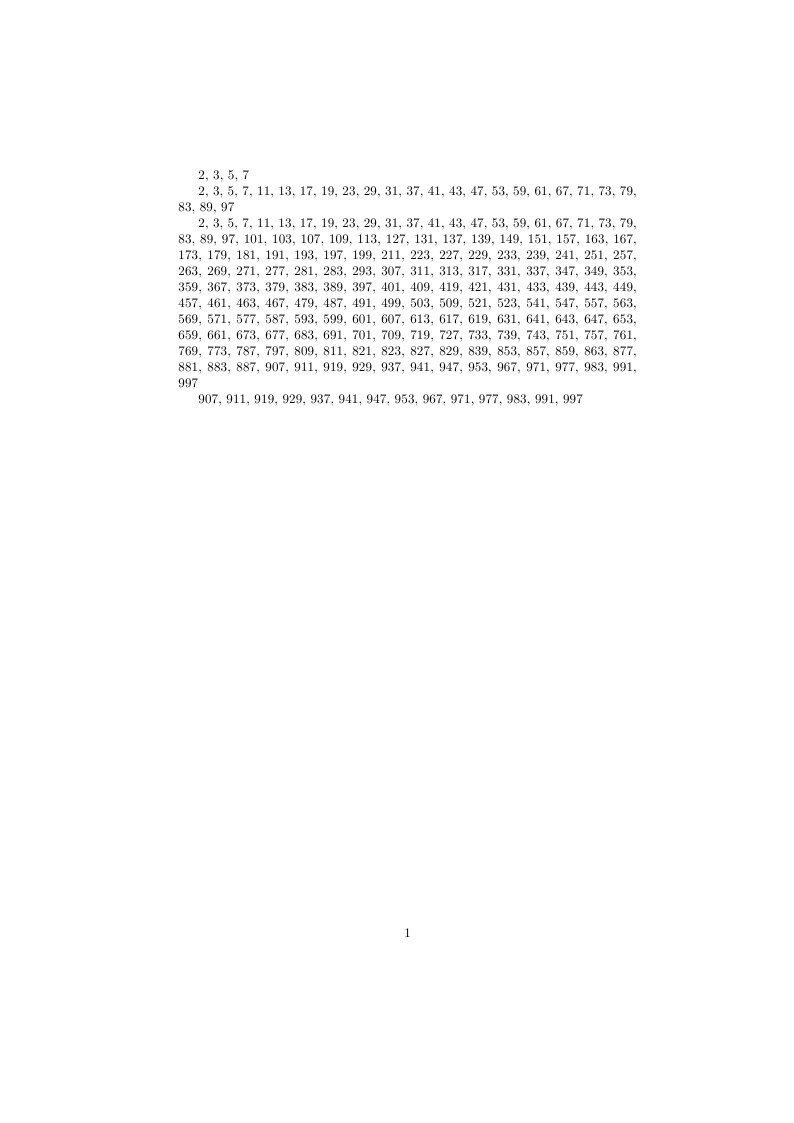
How to produce a list of prime numbers in LaTeX
This is an example or typesetting an approximation of the Overleaf logo, using the freely available fonts TeX Gyre Adventor and academicons. We hope you like it! We created it in response to a request from an Overleaf user who wished to include the sentence This document was created in \overleaf in their project. If you'd like to use this in your projects, please feel free to, but please also bear in mind our Acceptable Use Policy; the logo shouldn't be used to imply something is 'official' or otherwise endorsed by Overleaf. If you have any questions about it please get in touch!
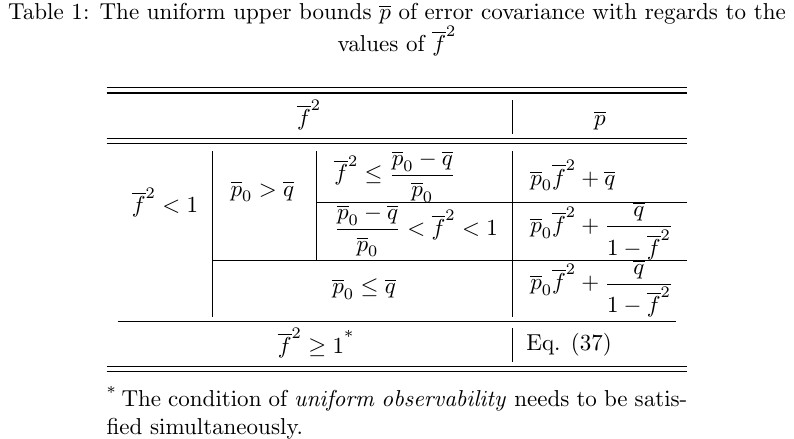
This is a table I used in the paper W. Li, G. Wei, D. Ding, Y. Liu and F. E. Alsaadi, "A New Look at Boundedness of Error Covariance of Kalman Filtering," in IEEE Transactions on Systems, Man, and Cybernetics: Systems, vol. 48, no. 2, pp. 309-314, Feb. 2018. I would like to share some LaTex codes for the table which might be helpful to some readers.
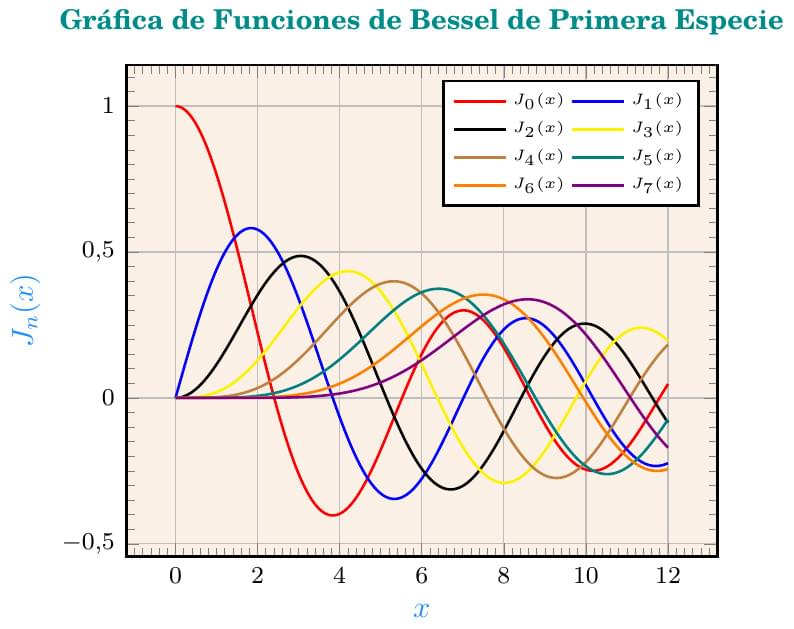
Este gráfico representa a las funciones de Bessel de primera especie, de las cuales fue publicada una primera versión por Overleaf con la diferencia de que, en lugar de usar el paquete GNUPLOTTEX, se usa el paquete PGFPLOTS con el software GNUPLOT, instalado en Overleaf.com, para calcular el trazado de ésta (y muchas otras curvas). Aunque PGFPLOTS es un paquete que produce gráficos de alta calidad, carece de rutinas breves y poderosas para el cálculo y graficación de funciones a partir de sumatorias, como sí tienen otros paquetes (como PSTRICK y GNUPLOT) , por lo que se usa la orden \addplot+[opciones_adicionales] gnuplot [raw gnuplot]{<órdenes de gnuplot>}, para indicar el dominio en el eje horizontal, la cantidad de muestras, la definición de la función de Bessel y la graficación (plot) de las 8 funciones en sus 50 primeros términos, variando solo el tamaño de "n" que determina el número de funciones a graficar. El gráfico presenta los valores "x" contra los valores de \(J_n(x)\) que representan a las funciones de Bessel de primera especie, trazado directamente sobre la cuadrícula dibujada mediante las rutinas de PGFPLOTS. En cada orden \addplot se define la n-ésima función de Bessel y se calcula la curva para cada valor particular de "n".
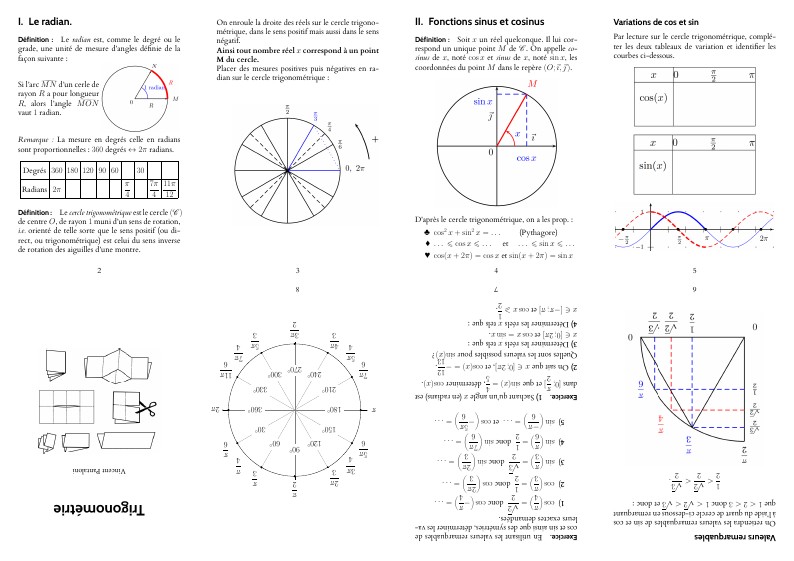
Trigonométrie anti-sèche résumé de cours de seconde. Mini-livre 8 A7 sur un A4 recto. cheatsheet antiseche pocketmod minibook trig sin cos circle cercle
This example shows how to load and use the apacite package. The apacite package uses LaTeX and BibTeX to generate citations and a reference list, formatted according to the rules of the American Psychological Association.
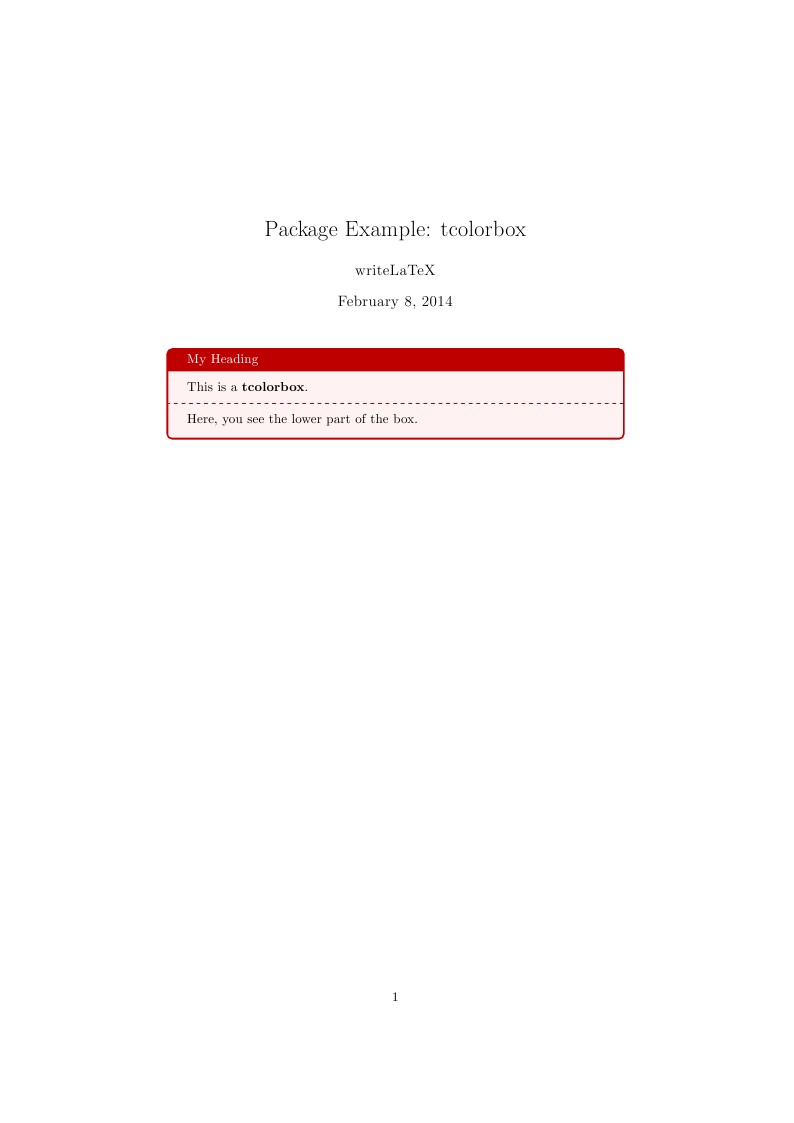
tcolorbox provides an environment for colored and framed text boxes with a heading line. Optionally, such a box can be split in an upper and a lower part. The package tcolorbox can be used for the setting of LaTeX examples where one part of the box displays the source code and the other part shows the output. Another common use case is the setting of theorems. The package supports saving and reuse of source code and text parts.
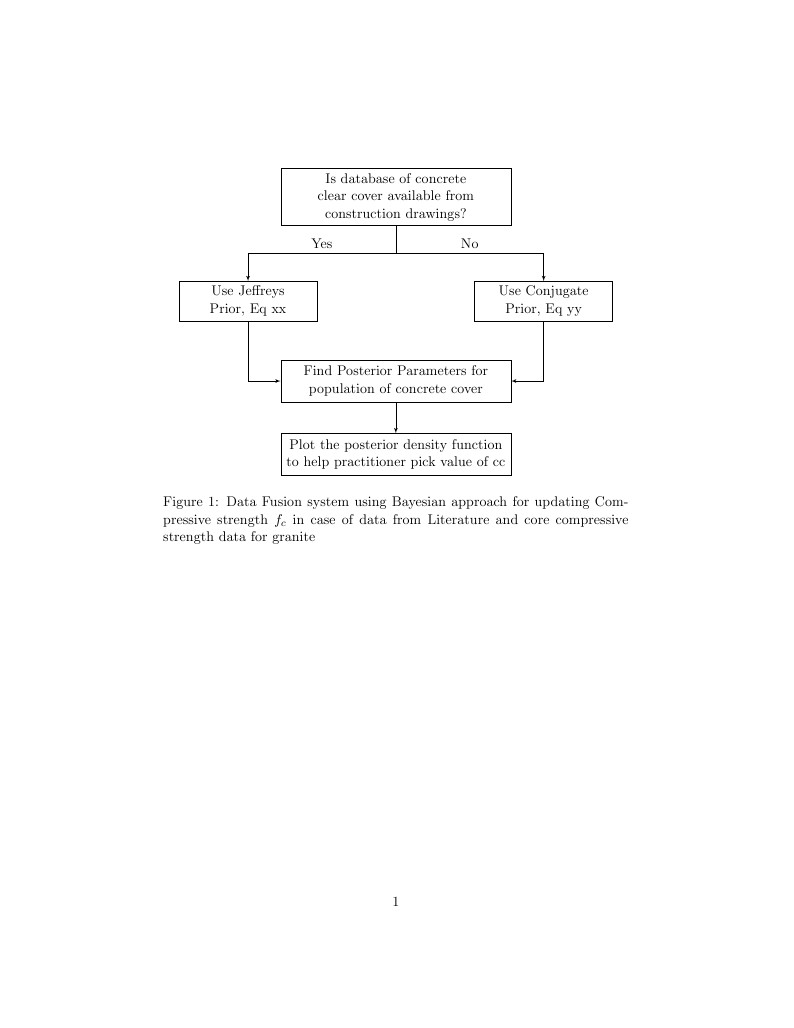
Branching arrows with decision option in flowchart
homework template
\begin
Discover why over 25 million people worldwide trust Overleaf with their work.