LaTeX templates and examples — Dynamic Figures
Recent
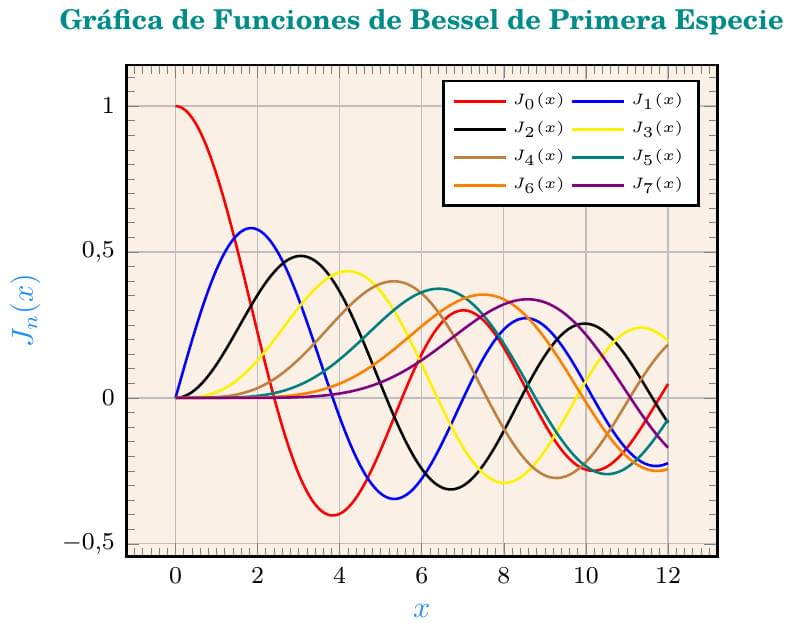
Este gráfico representa a las funciones de Bessel de primera especie, de las cuales fue publicada una primera versión por Overleaf con la diferencia de que, en lugar de usar el paquete GNUPLOTTEX, se usa el paquete PGFPLOTS con el software GNUPLOT, instalado en Overleaf.com, para calcular el trazado de ésta (y muchas otras curvas). Aunque PGFPLOTS es un paquete que produce gráficos de alta calidad, carece de rutinas breves y poderosas para el cálculo y graficación de funciones a partir de sumatorias, como sí tienen otros paquetes (como PSTRICK y GNUPLOT) , por lo que se usa la orden \addplot+[opciones_adicionales] gnuplot [raw gnuplot]{<órdenes de gnuplot>}, para indicar el dominio en el eje horizontal, la cantidad de muestras, la definición de la función de Bessel y la graficación (plot) de las 8 funciones en sus 50 primeros términos, variando solo el tamaño de "n" que determina el número de funciones a graficar. El gráfico presenta los valores "x" contra los valores de \(J_n(x)\) que representan a las funciones de Bessel de primera especie, trazado directamente sobre la cuadrícula dibujada mediante las rutinas de PGFPLOTS. En cada orden \addplot se define la n-ésima función de Bessel y se calcula la curva para cada valor particular de "n".
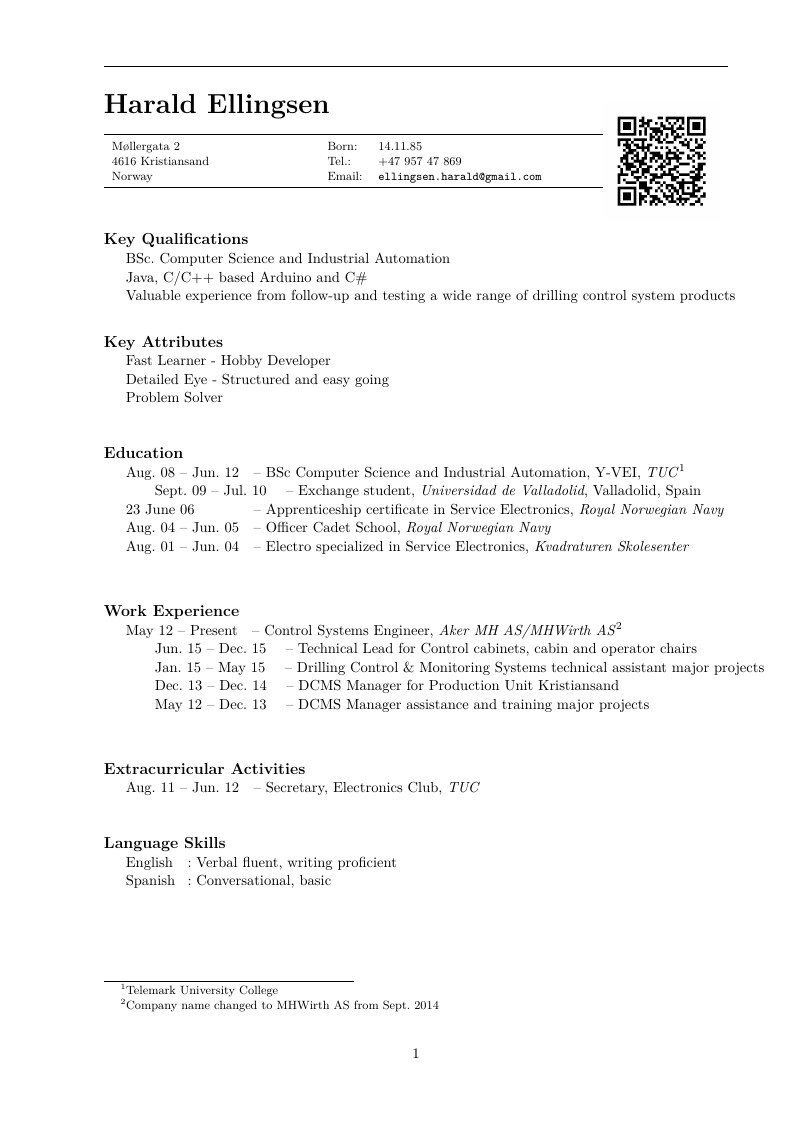
This is my CV as an example for those interested. Comments on the coding used is very welcomed.
Aula sobre Gráficos no LaTeX ministrada pelo professor Egmon Pereira a alunos do primeiro período de Eng. da Computação do Cefet-MG Unidade de Timóteo.
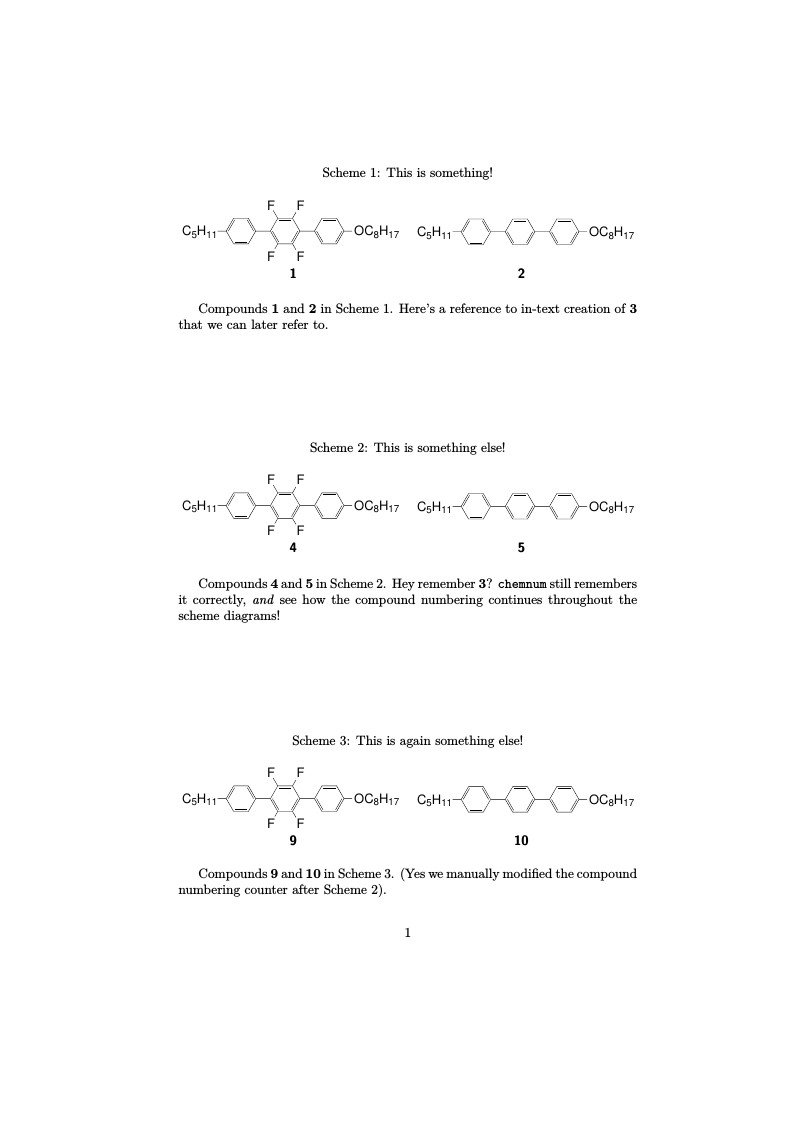
This example demonstrates how the chemnum package can be used to automatically number compounds in reaction schemes created with ChemDraw (saved as .eps files). While the chemstyle/chemscheme package can also be used, its author recommends the use of chemnum as it's deemed to be clearer. Ideally, the ChemDraw-generated .eps files should contain "TMP1", "TMP2" etc as temporary markers, which will then be replaced with automatically incrementing compound counters using the \replacecmpd command. Set your Overleaf project's compiler to be LaTeX (required for .eps images) when using this method.
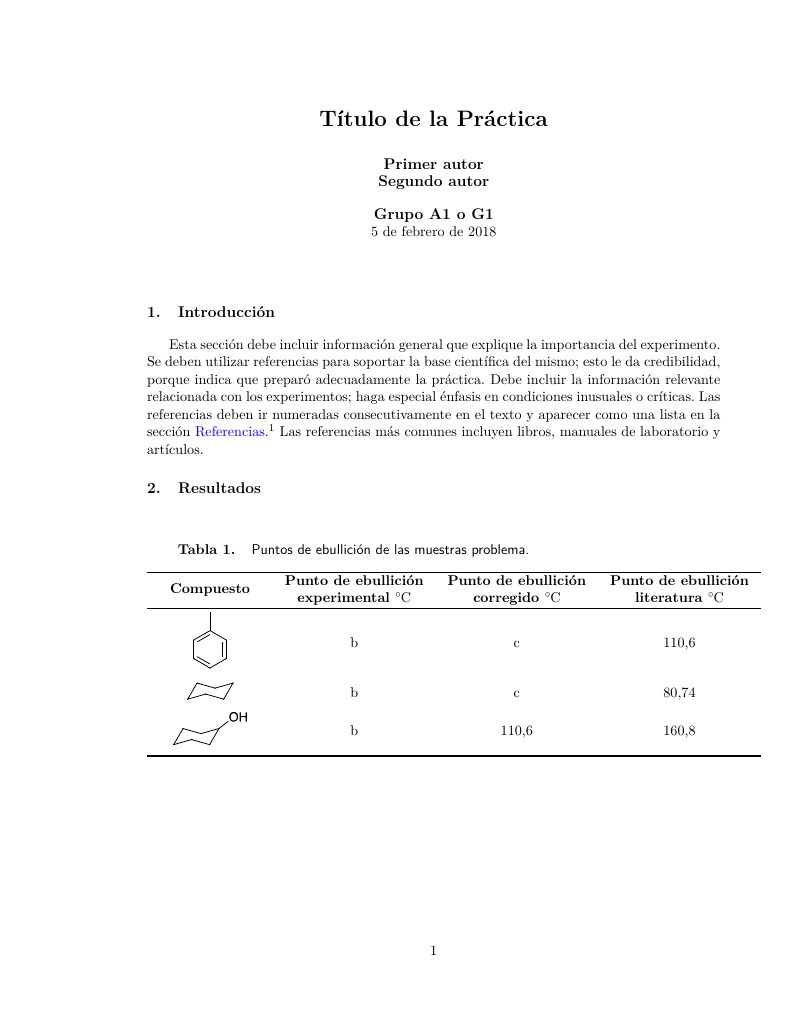
Plantilla para escribir los informes de Química Orgánica I
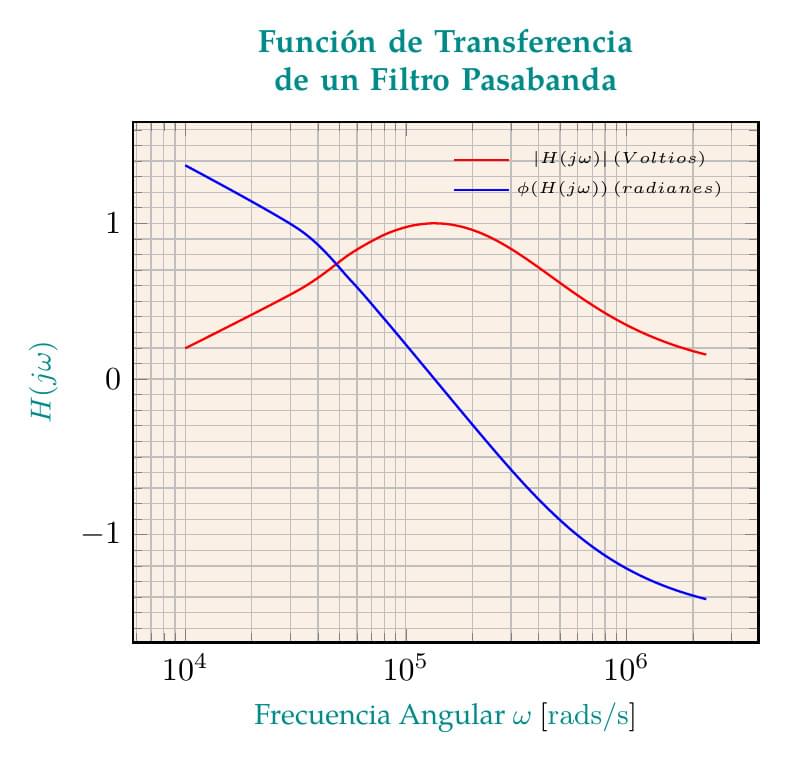
El presente es un gráfico doble de una Función de transferencia de un circuíto RLC en serie definida por la relación entre el voltaje en la resistencia (\(V_R\)) y el voltaje en la fuente (\(V_S\)). La ecuación obtenida es \(H(j\omega)=\frac{j\omega RC}{LC(j\omega)^2+RCj\omega+1}\). En el listado, se definen los valores de R, L y C en función de los cuales se traza la gráfica de la ganancia (en rojo) y del desfase (en azul), para el rango de frecuencias considerado. La función de transferencia fue obtenida de la web "Guía práctica para construir un diagrama de Bode y se aprovecha el uso de GNUPLOT para graficar la función de transferencia, la cual depende de variables complejas.
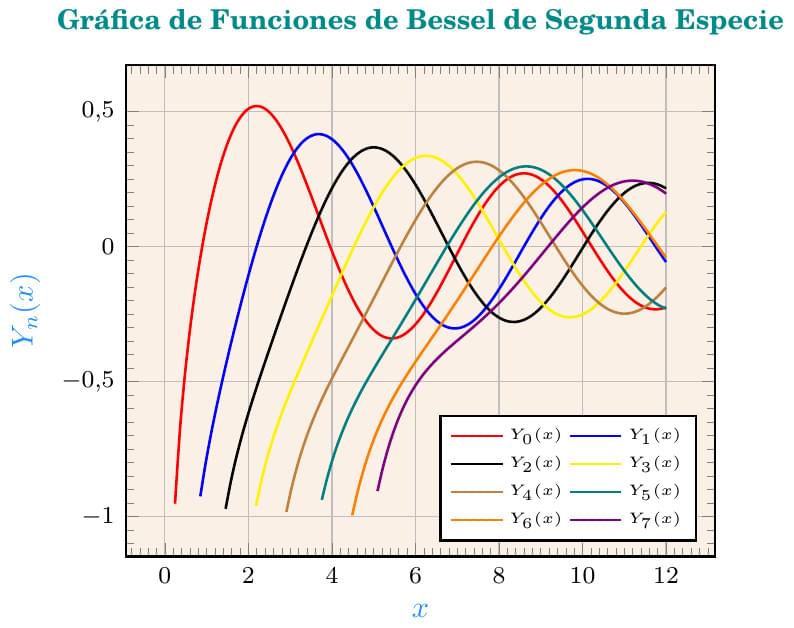
Este ejemplo es una gráfica de las 8 primeras funciones de Bessel de segunda especie \(Y_n(x)\) tal como se definen en el enlace, aunque en este caso se usan directamente las funciones que están incorporadas en GNUPLOT, besy0(x) y besy1(x). Para obtener las definiciones de las funciones de Bessel de segunda especie para un número \(n \geq 2\), se recurre a las que aparecen en este enlace que son válidas para las funciones de Bessel, tanto de primera como de segunda especie. Para el trazado de las 8 curvas uso un bucle \foreach y dentro del bucle, la orden \addplot+ con las opciones adecuadas para que las curvas aparezcan en colores diferentes.
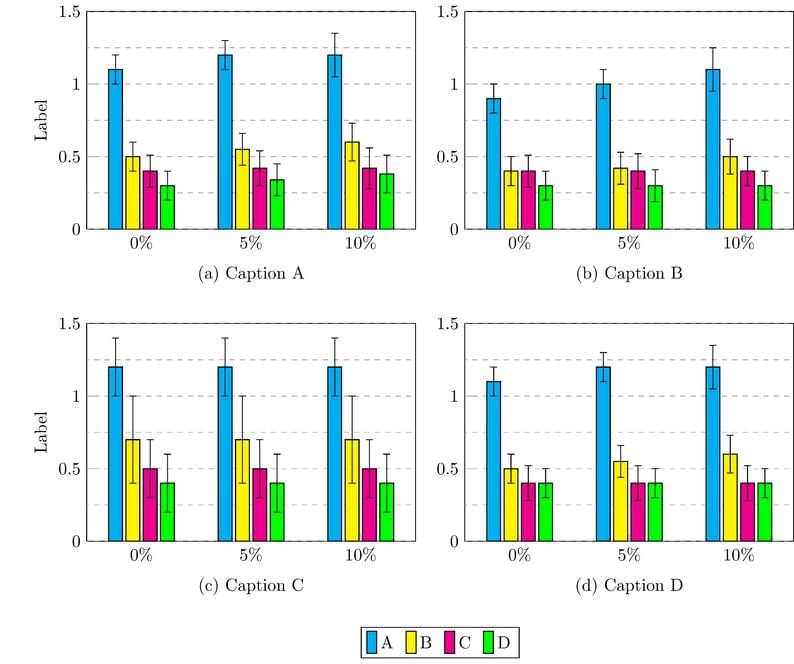
Create a groupplot of barcharts where the data is read from text files using the PGFPlot package.
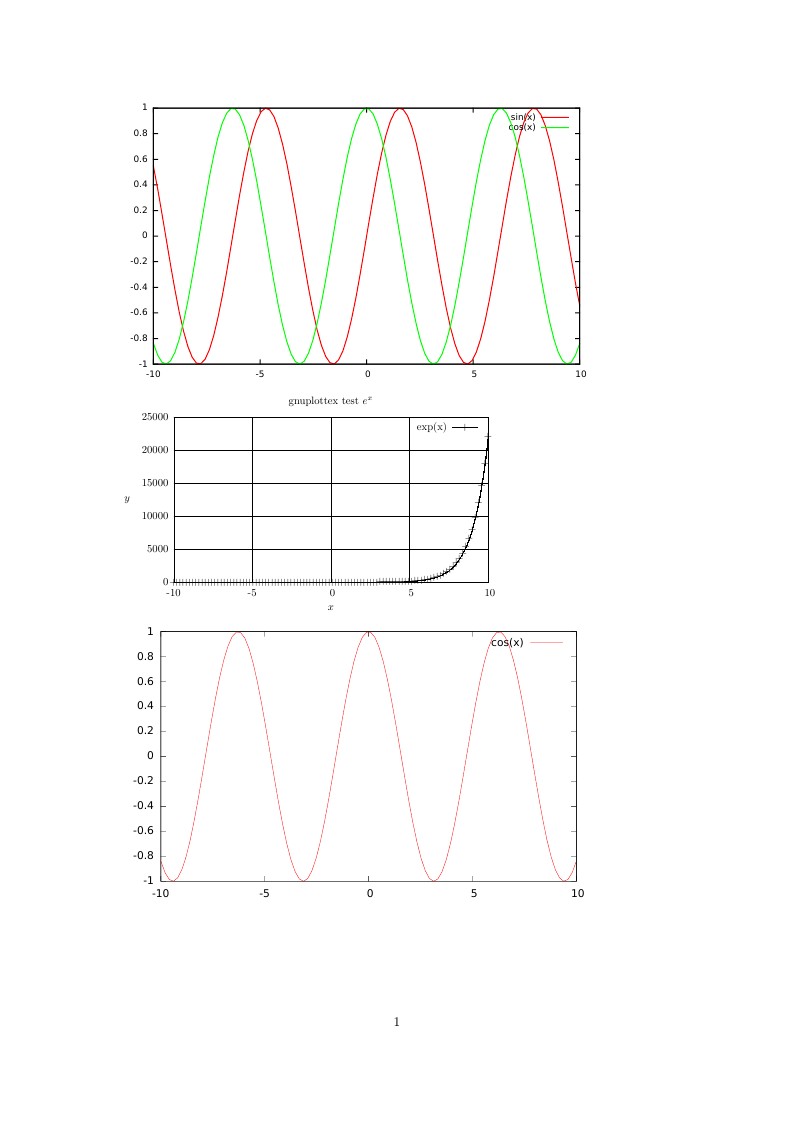
An example on using gnuplot right in LaTeX with the gnuplottex package
\begin
Discover why over 25 million people worldwide trust Overleaf with their work.