LaTeX templates and examples — TikZ
Recent
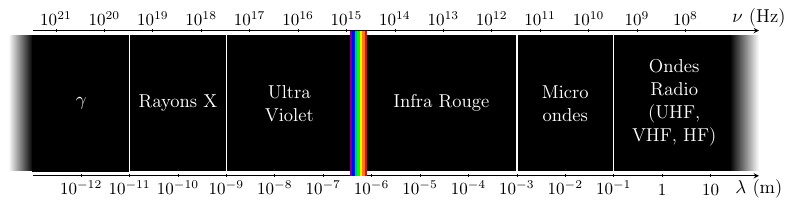
Ce document regroupe les codes TIKZ des figures utilisées pour le cours "lois de l'optique géométrique" situé à la page: http://femto-physique.fr/optique_geometrique/opt_C1.php

Flag of the Republic of Chile, according to official government specifications
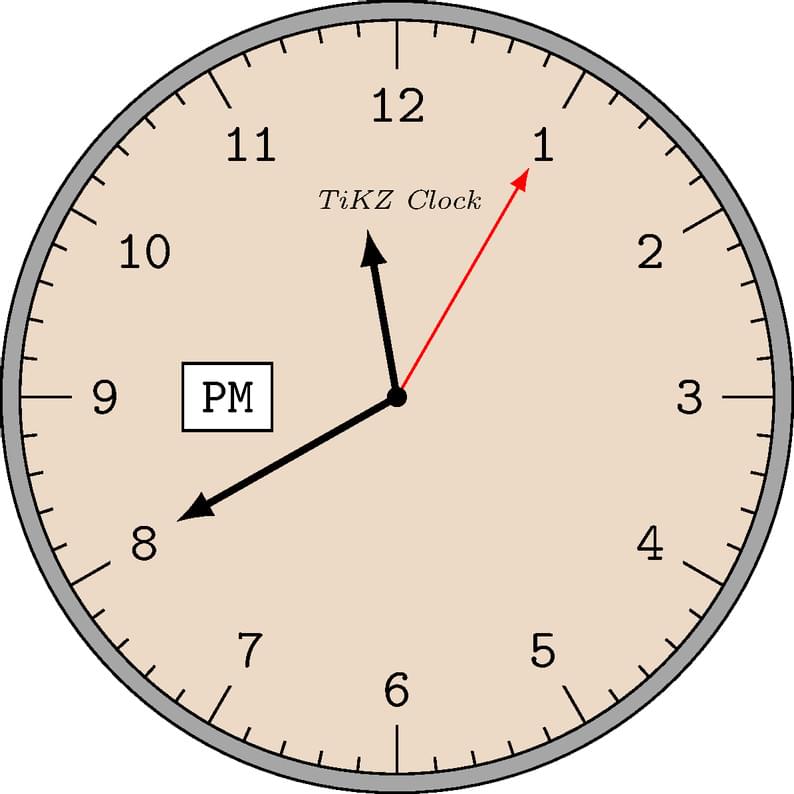
A clock powered by the tikz package
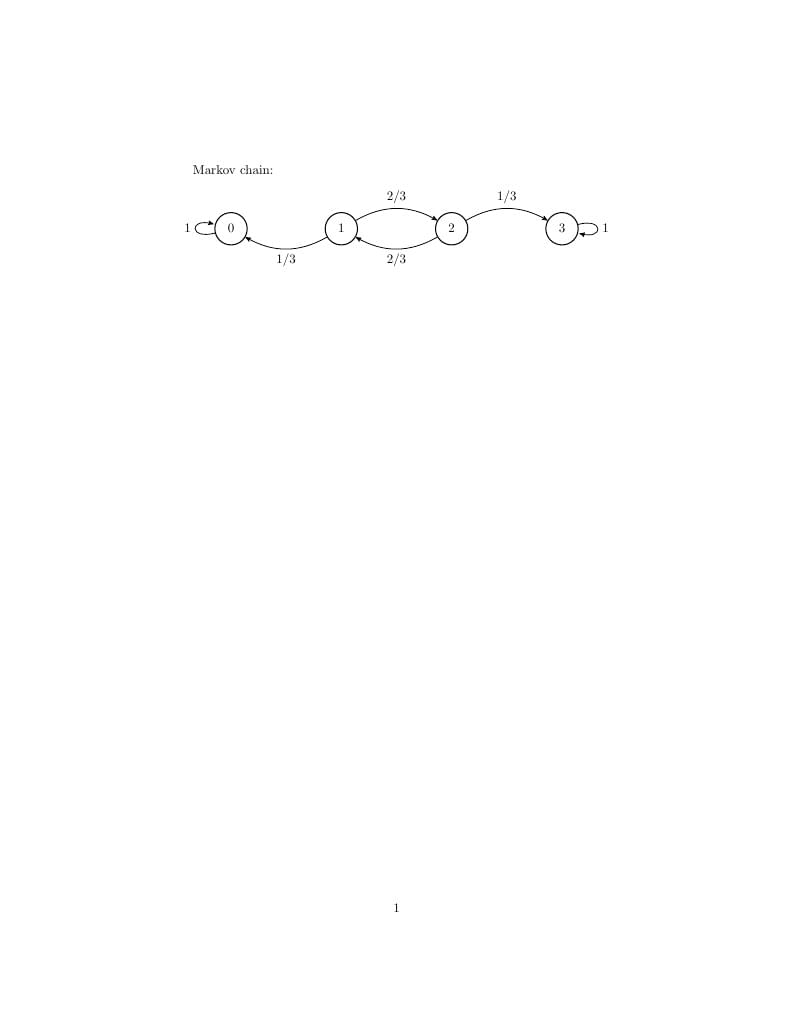
Markov chain. Nodes example

Turkish national flag with TiKz.
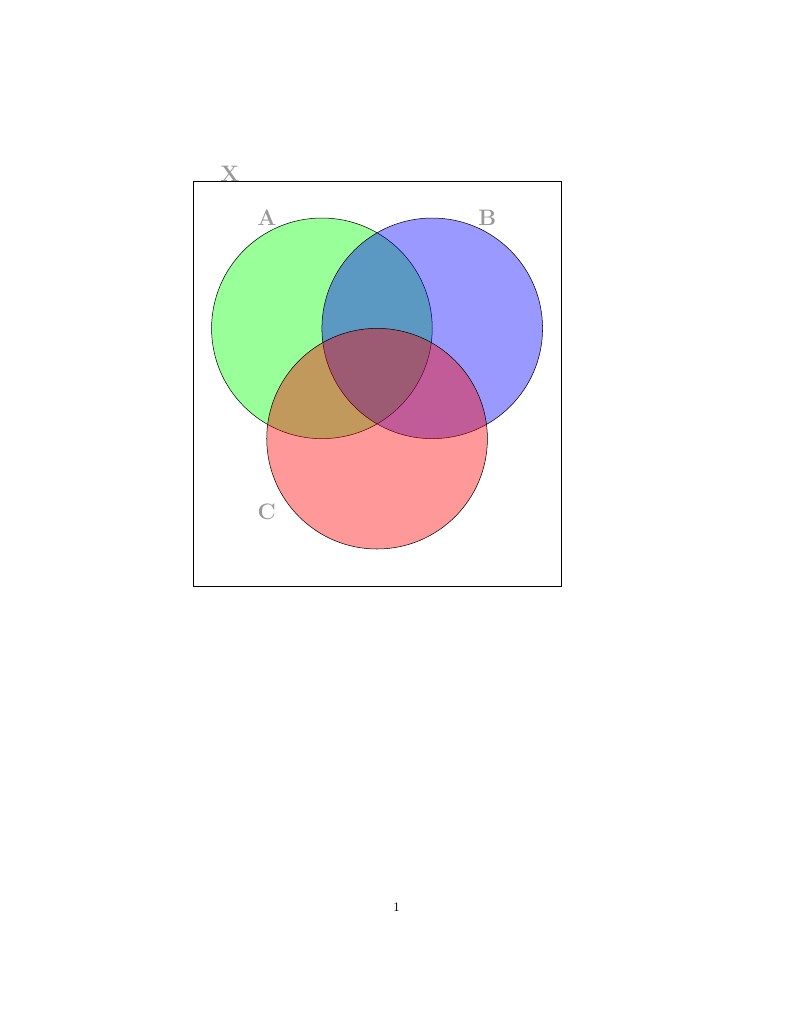
This is a short template on the creation of Venn Diagrams.
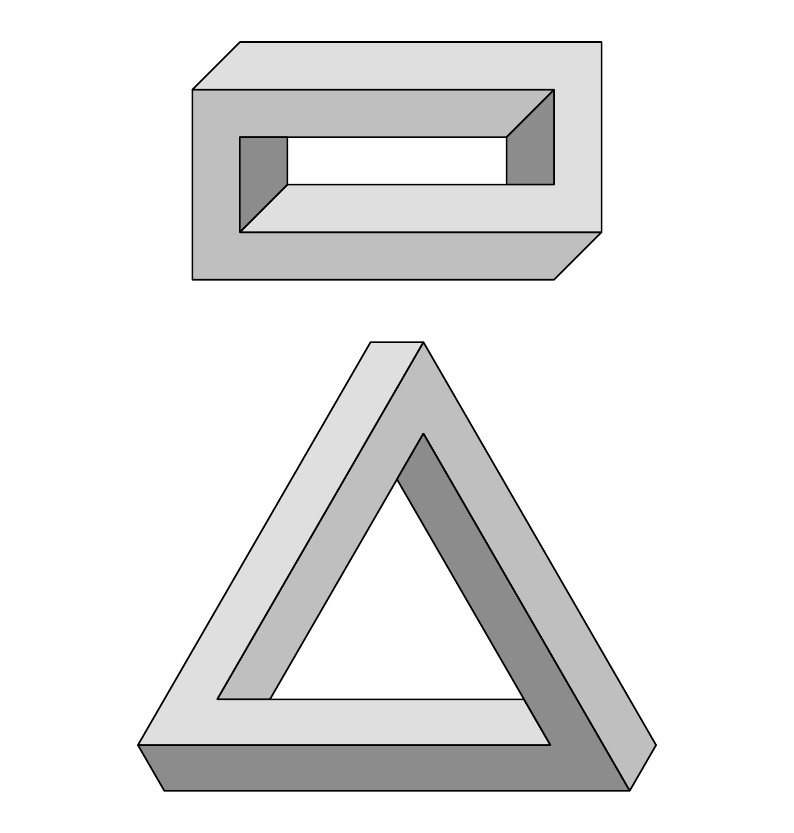
A drawing in TikZ. The first picture draws an impossible brick, which induces an optical illusion similar to that triggered by Escher's impossible cube. The second picture draws a Penrose triangle, another similar optical illusion.
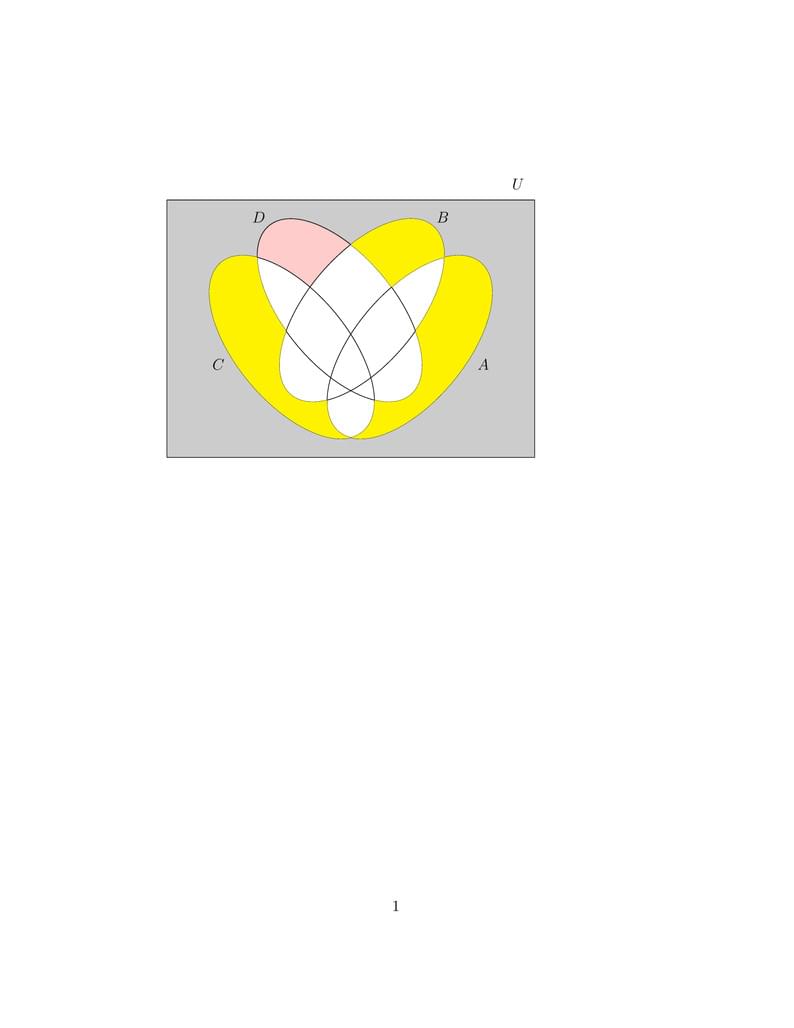
This example helps to show how the isolated areas of a Venn diagram can be filled / coloured. It was created as part of this answer on TeX StackExchange. Other options for creating Venn diagrams with multiple areas shaded can be found in the Overleaf gallery via the Venn Diagrams tag.
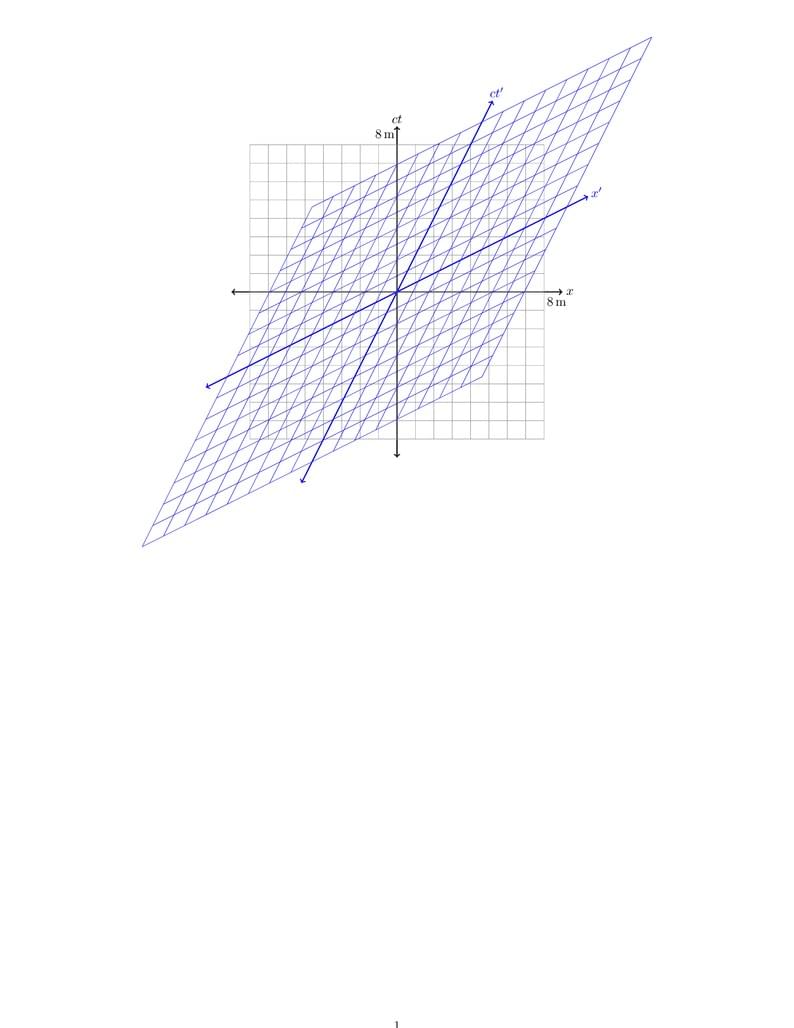
Generates a Minkowski spacetime diagram with a given grid spacing, grid cell count, and velocity as a proportion of c.
\begin
Discover why over 25 million people worldwide trust Overleaf with their work.